



Flow Metrics in Scrum Ceremonies: A Data-Driven Approach for Game Development
Using flow metrics empowers Scrum teams to move beyond estimations, embrace data-driven decision-making, and improve continuously by focusing on the flow of value.

Deep Dive by NotebookLM
Flow metrics improve Scrum by replacing subjective estimates with data-driven forecasting, increasing efficiency and adaptability in game development.
Key flow metrics—Work in Progress, Throughput, and Cycle Time—enhance planning, reduce bottlenecks, and provide real-time insights for better decision-making.
Integrating flow metrics into Scrum ceremonies streamlines sprint planning, daily stand-ups, reviews, and retrospectives, fostering continuous improvement and transparency.

Clinton Keith's seminal book “Agile Game Development with SCRUM”, published in 2010, introduced a revolutionary approach to project management in game development. This book brought Agile and Scrum methodologies to the forefront for game developers and tailored these practices to meet the industry's unique challenges. Keith's insights provided clear strategies for applying these methods effectively, setting the stage for more dynamic and efficient workflows within game development.
A decade later, Daniel Vacanti and Will Seele further advanced Scrum project management with their publication, "Flow Metrics for Scrum Teams" (available for free download). This work, built on the foundation of “Actionable Agile Metrics for Predictability: An Introduction”, emphasised the value of flow metrics, traditionally associated with Kanban, in Scrum environments. By focusing on completed work items instead of subjective estimates, these metrics have enhanced productivity measurement, enabled more accurate project forecasting, and streamlined planning. The increased visibility into workflows and real-time data have made Scrum processes more efficient, increased team adaptability, and reduced time spent on estimation debates, leading to more data-driven decision-making and better project outcomes.
Flow metrics are versatile and can be implemented in any process where tasks are initiated and completed, making them invaluable across different methodologies. Their integration into Scrum has extended team capabilities beyond traditional practices, fostering more dynamic and efficient workflows.
The importance of flow metrics in game production is profound. They encourage teams to ask questions early, facilitating swift and informed decision-making. This proactive approach is essential as it shows how our policies influence our data, shaping our strategies and tactics. Moreover, these metrics shift the focus from traditional estimation to a more precise forecasting model, reducing reliance on guesswork and enhancing planning accuracy with actual throughput and cycle time data.
Furthermore, the clear takeaway is that uncertainty is best addressed not through meticulous planning but through action—the tangible progress achieved by doing work. Metrics thus play a crucial role in providing insights and fostering collaboration among team members, enabling a unified approach to tackle challenges and achieve goals. This evolution from estimation to forecasting, driven by flow metrics, significantly boosts the effectiveness of game production practices, ensuring teams are more adaptive, transparent, and successful in their endeavors.
My regular readers know how strongly I advocate for flow metrics, a stance born from extensive firsthand experience. Throughout my career as a game producer utilising Scrum, I've consistently encountered limitations related to estimation and the lack of actionable data. These challenges often meant reacting to issues after the fact rather than addressing them proactively.
Most of my teams used Jira as a repository for tasks and bugs, leveraging only a handful of its native reports. This setup failed to provide the levers needed to impact leading measures or to act on issues as they occurred. Our continual adjustments to Scrum, aimed at extracting more value, yielded mixed results at best.
The turning point came when I discovered the ActionableAgile Analytics Jira plugin (also available as a SaaS product). This tool had a significant impact, finally offering the proactive control I had long sought. With this enhanced toolset, I could effectively implement flow metrics, transforming how we managed projects.
Embracing flow metrics has been one of the most impactful changes in my career. These metrics have filled the gaps we previously tried to plug with ad-hoc Scrum modifications, providing a clear before-and-after contrast in our project management effectiveness. Flow metrics address all these gaps, facilitating a more dynamic and efficient workflow that allows us to act on issues in real time rather than merely reacting to them postmortem.
Benefits of Flow Metrics in Scrum Ceremonies
The primary objective of utilising flow metrics is not merely to collect data but to enable teams to ask pertinent questions at the correct times, thereby enhancing decision-making processes. These metrics provide insightful data that fosters collaboration among team members and stakeholders, ensuring everyone is aligned and informed.
Moreover, flow metrics enhance transparency and provide an objective basis for assessing team performance. This data is invaluable as it offers a clear and factual representation of a team's performance, which is far more reliable than subjective evaluations typically used in many project environments.
Flow metrics can also reduce time consumption, particularly in meetings such as sprint planning. Teams can reduce the time spent on speculative estimation and focus instead on achieving tangible goals. This shift saves time and enhances productivity by centering efforts on actionable objectives rather than predictive guesswork.
Additionally, flow metrics enable teams to move away from traditional and often restrictive measures such as story points. By focusing on elapsed time—including all time during which work is in progress, not just active "touch time"—teams gain a more comprehensive understanding of their cycle times. This holistic view facilitates more accurate planning and process adjustment.
One of the overarching goals of adopting flow metrics is to steer teams away from what is sometimes referred to as "estimation theatre," the practice of placing undue emphasis on estimates that may not accurately reflect actual project dynamics. By focusing on concrete data and real progress, teams can avoid the pitfalls of over-reliance on estimates and instead build processes that genuinely reflect and support their workflow and objectives.
Flow Metrics
Here are the three fundamental flow metrics:
Work in Progress (WIP): This indicates the number of tasks being worked on. Monitoring WIP helps teams manage their workflow to avoid bottlenecks and maintain a steady flow of work, ensuring that no stage of the process is overwhelmed or underutilised.
Throughput: This metric measures a team's work within a specific period, such as the number of Product Backlog Items (PBIs) finished per sprint. It provides a historical performance baseline, helping in forecasting and planning.
Cycle Time: This metric tracks the total time from the start of work on an item until its completion. Focusing on the elapsed time (the total time an item is in the workflow) and touch time (the actual time spent working on the item) gives a comprehensive view of how processes might be streamlined.
In addition to these metrics, we will be exploring these related items:
Work Item Age: Measures how long a work item has been in the system without completion. It helps identify stuck or delayed items, prompting teams to investigate and address the causes of hold-ups.
Service Level Expectation (SLE): Based on historical data, this performance metric predicts the probability of completing a task or project within a certain time frame. It is a decision-making tool for determining whether an item should be included in a sprint or needs further refinement.
Monte Carlo Simulations: Monte Carlo simulations are a statistical technique that uses random sampling to predict the outcomes of a process. In project management, they help forecast task completion rates by analysing historical data, aiding in more accurate planning and risk assessment.
Right-sizing: A technique of breaking down work items into smaller, manageable pieces that can be completed within a specific timeframe. It improves flow and predictability.
You can read more about Flow Metrics here:

Flow Metrics in Scrum Ceremonies
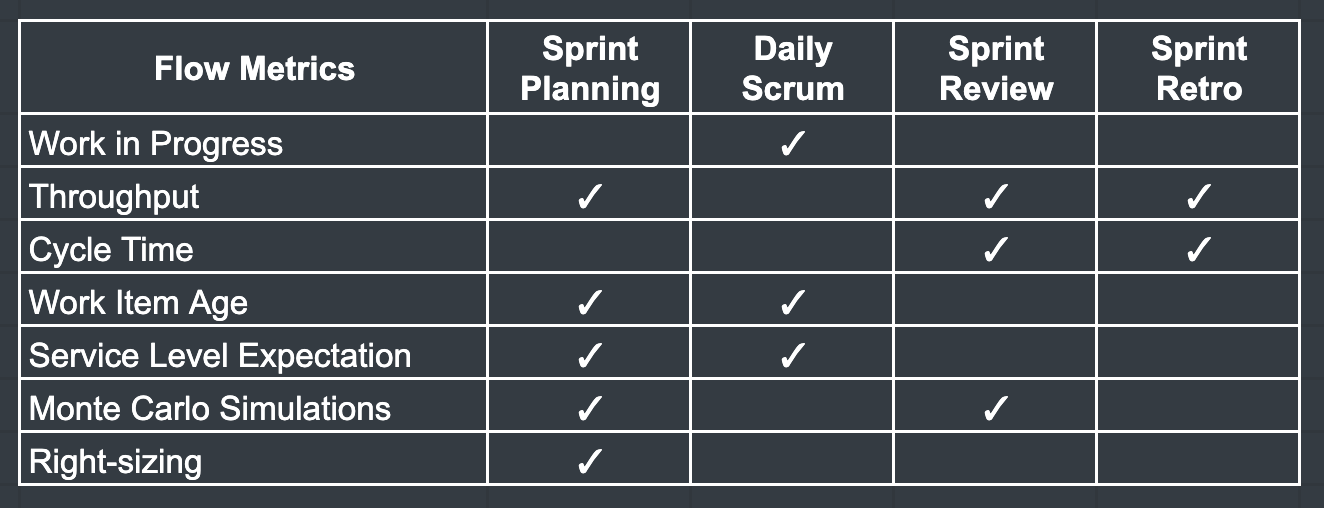
Below, we break down the use of Flow Metrics for these Scrum ceremonies:
Sprint Planning
Daily Scrum
Sprint Review
Sprint Retrospective
Sprint Planning
Sprint Planning is crucial for ensuring a successful sprint. By incorporating flow metrics into this phase, teams can ground their planning in data-driven insights, which helps them set realistic goals and expectations.
Throughput: Historical throughput data can forecast the number of product backlog items (PBIs) that can be completed in a sprint. This approach shifts planning from guesswork to a data-driven strategy.
Monte Carlo Simulations: These simulations can be applied to predict the completion of PBIs based on historical data, enhancing the accuracy of sprint planning.
Work Item Age: Analyze the age of items from previous sprints to decide their handling in the current sprint.
Right-sizing: Discuss and evaluate if a PBI can realistically be completed within a set timeframe, such as 11 days or less, to determine if further splitting or refinement is necessary.
Service Level Expectation (SLE): Use SLE as a criterion to decide if a PBI should be pulled into the sprint, ensuring that items are feasible to complete as planned.
Daily Scrum
The Daily Scrum is an essential touchpoint for Scrum teams. It serves as a platform for discussing progress and impediments. Integrating flow metrics into this daily meeting enhances focus and drives actionable insights.
Work Item Age: Highlight and address items that are aging beyond the norm. This can help pinpoint and solve workflow delays.
Work in Progress (WIP): Monitor the amount of ongoing work to maintain a balanced load that prevents bottlenecks and underutilisation.
Process Management: Daily scrums are critical for process adjustments; utilise metrics to swarm on delayed items, break tasks down further, or tackle external dependencies.
Service Level Expectation (SLE): Use SLE triggers to take immediate action on items that are not progressing as expected.
By incorporating these metrics into the daily scrum, teams can proactively manage their workflows, address issues as they arise, and maintain momentum throughout the sprint.
Sprint Review
The Sprint Review is a time to reflect on what was accomplished and what could be improved. This ceremony utilizes flow metrics, which provide concrete data to guide discussions on past performance and future planning.
Throughput and Cycle Time: Review these metrics to understand the team's delivery rate and discuss improvements. This can assist with future release planning and give stakeholders a clear picture of team performance.
Monte Carlo Simulations: These are used during reviews to model risk and refine release plans with stakeholders, increasing transparency and confidence in the timelines.
Flow Metrics in Stakeholder Communication: Employ flow metrics to answer queries about completion times for specific features, enhancing stakeholder communication.
Flow metrics into the sprint review enable teams to present a data-backed view of their work, fostering more informed discussions with stakeholders and better decision-making for future sprints.
Sprint Retrospective
The Sprint Retrospective allows teams to examine and evolve their processes. Flow metrics play a critical role in this ceremony, pinpointing areas for improvement and tracking the impact of changes made.
Analyzing Metrics: Examine WIP, cycle time, and throughput to identify process improvement opportunities. Look for trends and outliers that suggest areas of concern.
Evaluating Workflows: Consider adjusting WIP levels and strategies to optimise flow and reduce cycle times, which can help streamline operations.
By focusing on flow metrics during the retrospective, teams can ensure continuous improvement, leading to more efficient and effective Scrum cycles.

Conclusion
By embracing flow metrics across Scrum events, teams can transition from estimative to empirical practices, enhancing every aspect of project management. This strategic adoption improves current processes and sets a foundation for ongoing improvement, making Scrum teams more adaptive, transparent, and successful.